Air Quality in Kaikorai Valley: Seasonal Differences
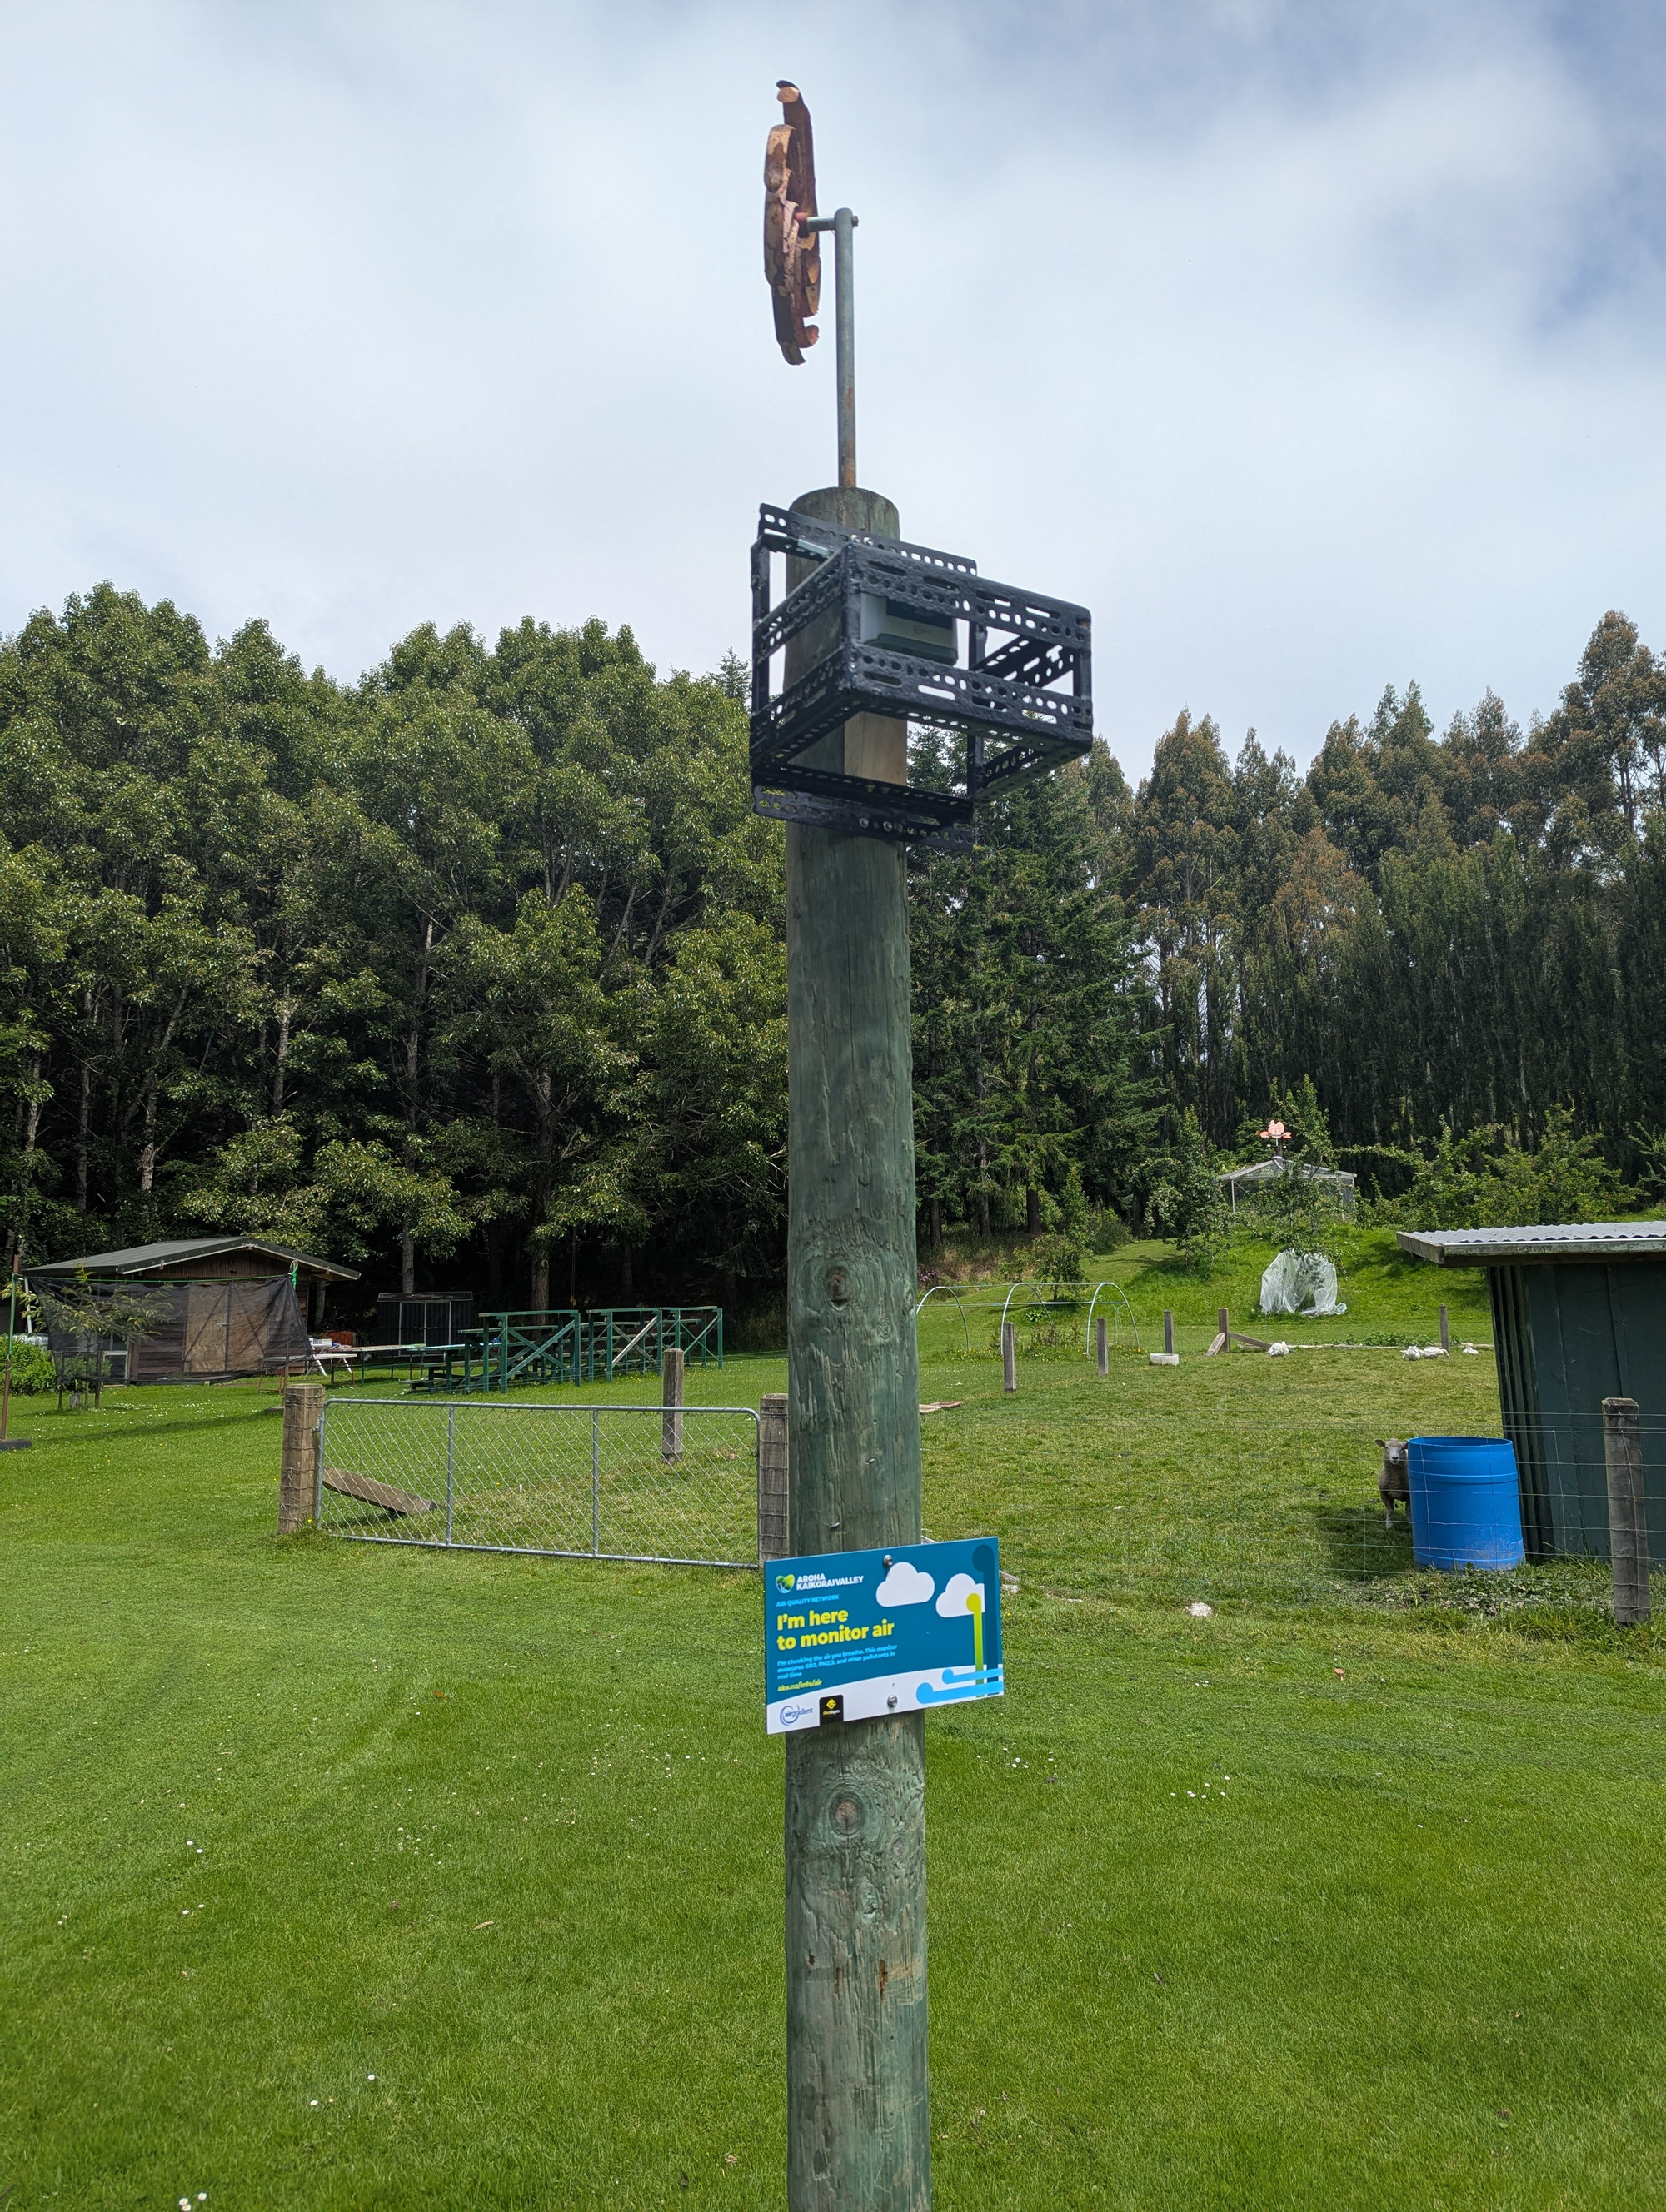
Since July last year, Aroha Kaikorai Valley has been collecting air quality data and rolling out monitors thanks to the support of residents and businesses. We currently have 9 active monitors, helping us better understand air quality trends across the valley.
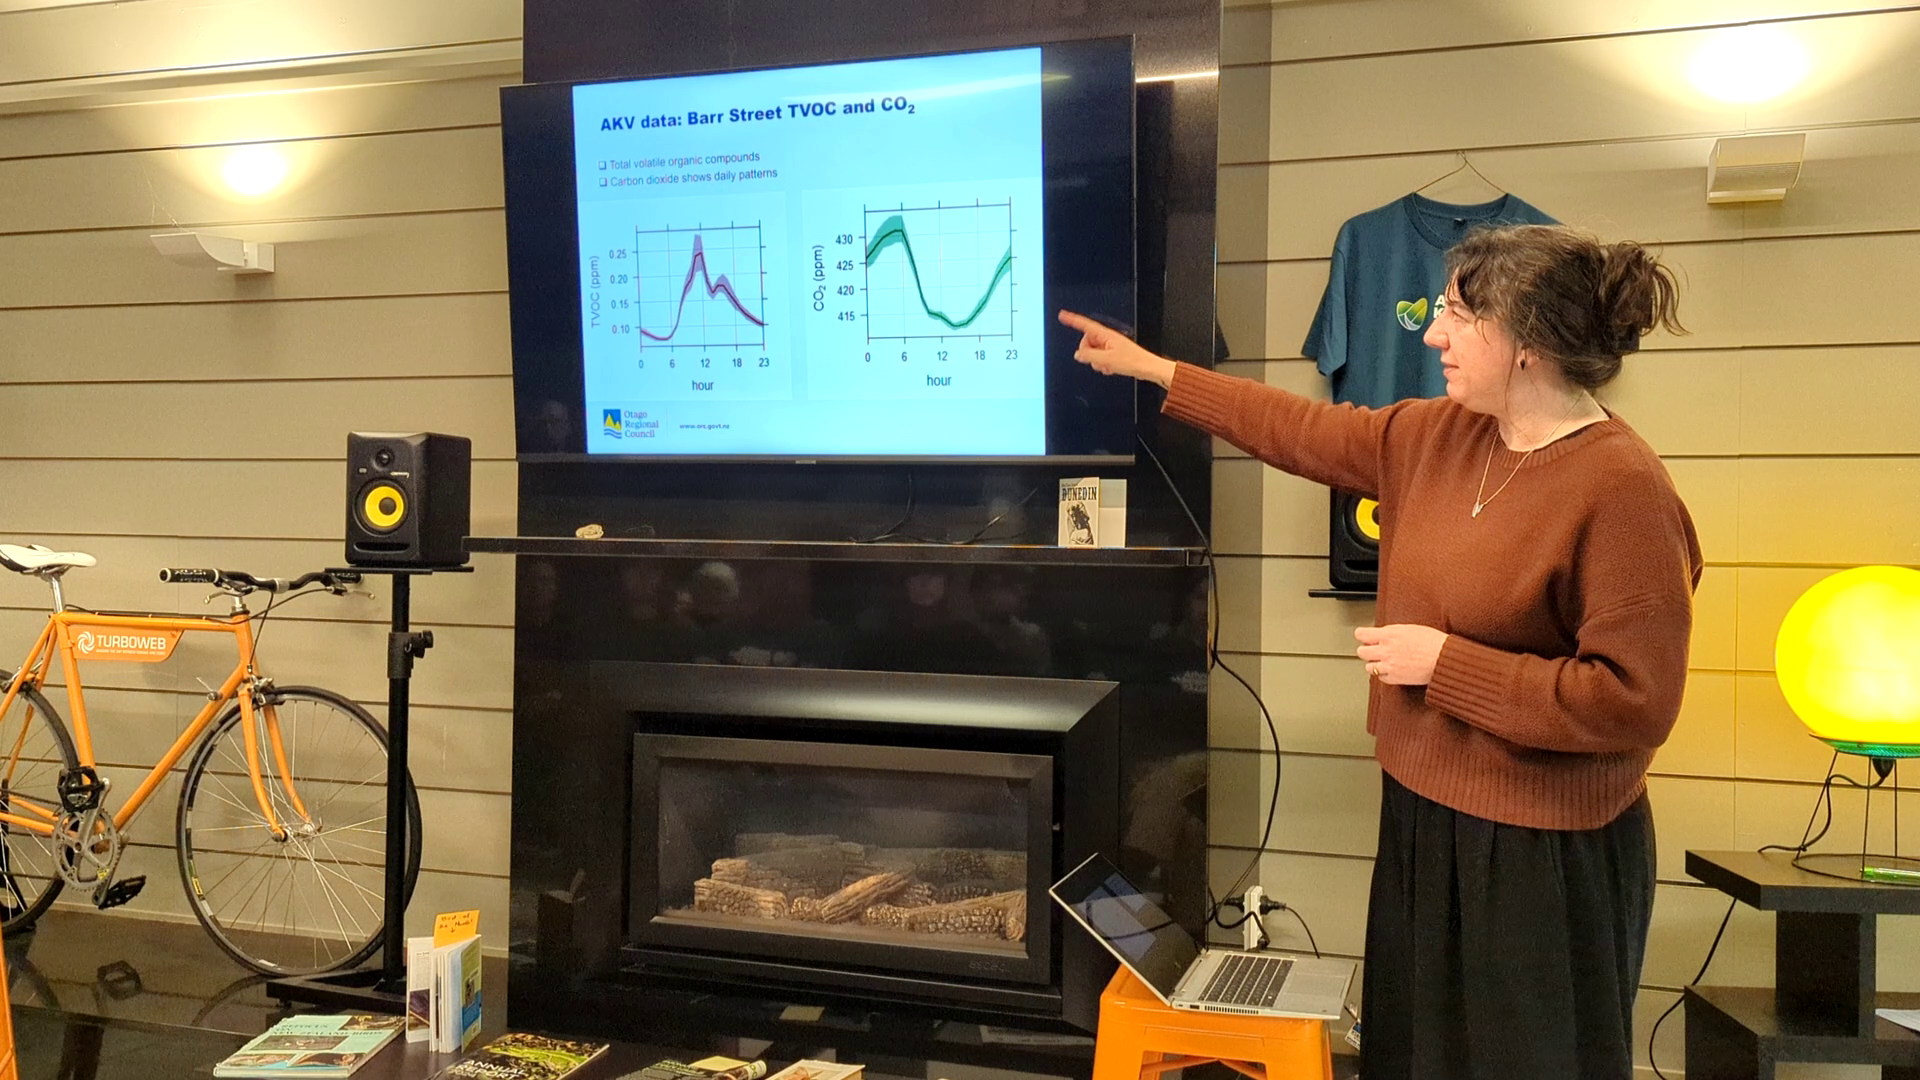
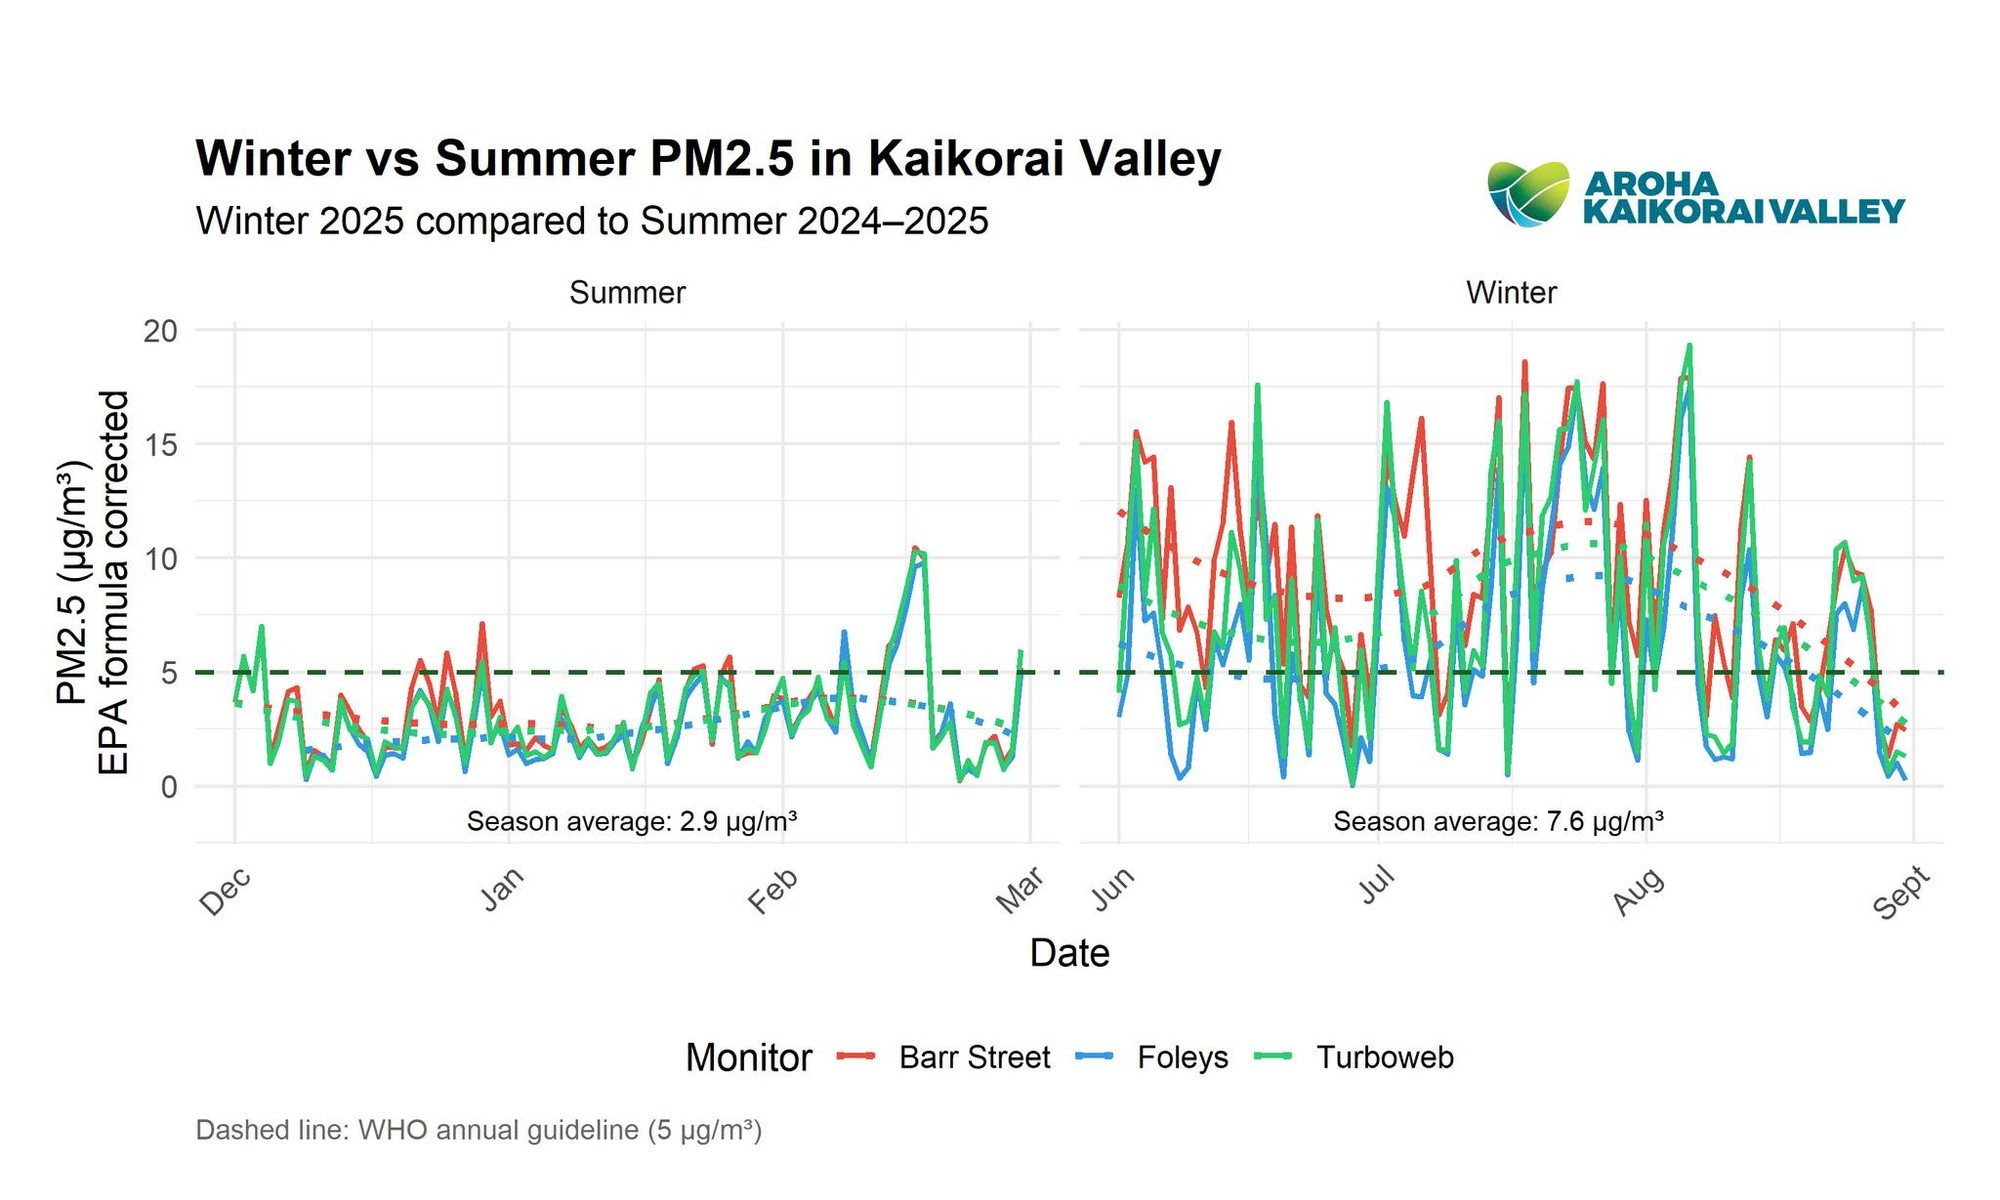
For comparison, we looked at monitors with data from both last summer and this winter, including Foleys Dunedin, Turboweb, and Barr Street. The results show a clear seasonal difference in PM2.5 levels, with winter averaging 7.6 µg/m³ compared to 2.9 µg/m³ in summer — a 162% increase. This demonstrates how air quality can worsen significantly during the colder months, mainly due to home heating from wood and coal burning. Older fires can produce far more pollution than modern low-emission burners.
Fine particles like PM2.5 and gases such as nitrogen dioxide can affect health, contributing to asthma, hospitalisations, and restricted activity days. Kaikorai Valley is particularly vulnerable because its geography, combined with temperature inversions, can trap pollutants close to the ground.
As we gather more data, we’ll be able to compare results across more monitors and see how our measurements align with the Otago Regional Council’s monitor on Clyde Street.
If you’d like to support the project, we’d love to deploy more monitors and expand coverage across the city.
Check the live data here: AirGradient Map | AKV Air Quality Info